Protect Portfolio, Limit Further Losses COPY SMARTRobie®
AI-driven market pullback pressured positions; COPY SMARTRobie® cut losses early for a series of trade to preserve your portfolio safety.
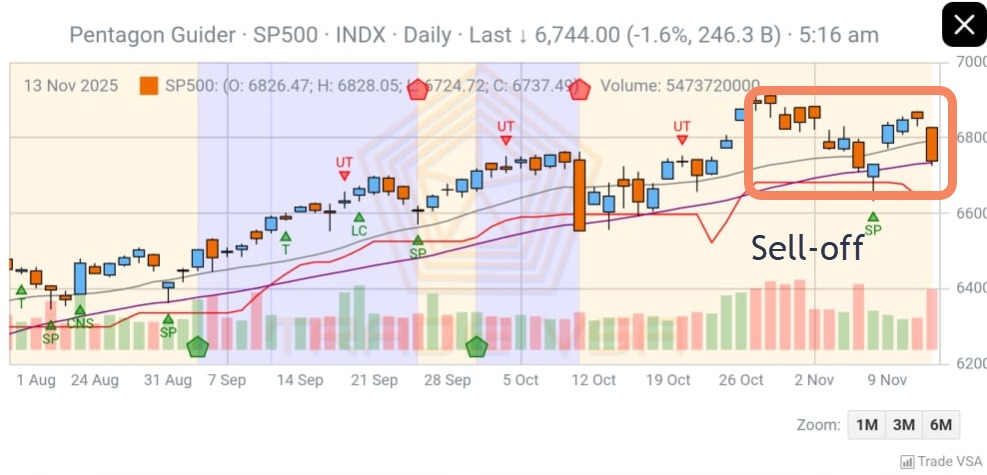
Between Oct 27-Nov 13, 2025, the NASDAQ fell more than 2.3%, with sharp volatility from the AI-sector sell-off. These fast swings triggered multiple stop-loss levels across COPY SMARTRobie® trades. To protect capital, the system exited Lam Research, AIG, Emerson, HPE and XLC ETF as market weakness accelerated during this period.
AI Tech Market Correction: COPY SMARTRobie Defensive Update
Following the recent US market correction highlighted in the NVIDIA-led tech selloff, we exited NDAQ and IBM as volatility triggered our stop-gap rules, resulting in closed losses. With further corrections likely, COPY SMARTRobie will adjust position sizing to stay defensive while preparing for the next opportunities.
• Once you have subscribed to Copy SMARTRobie®, your 3-months All Exchange pass will be activated within 24 hours.
• Once All Exchange monthly pass is activated, your Copy SMARTRobie® subscription is activated too.
• When SMARTRobie® execute a trade, you will receive the same information via in-app notification.
• Check your Copy SMARTRobie® trade idea in your Inbox of your SMARTRobie® app.
• Follow Coffee with SMARTRobie® every Monday at 10.15am (FB Live @ FB/SMARTRobie) should you have question on SMARTRobie®.
Disclaimer
• All buy calls are based on ALGO Pentagon Guider® System on SMARTRobie®. See our SMARTRobie® FAQ for all assumptions and limitations. Investing is risky and trading is at your own risk.
• Past performance is not an indicator of future performance. There are risks involved in buying and selling shares. Please have proper risk management when trading shares as a loss of money is highly probable.
View this bot performance as in monthly returns in 2026:
Month
Returns %
Compared To SP500 Returns %
Jan
-
2.70
Feb
-
-1.42
Mar
-
-5.75
Apr
2.21
-0.76
May
7.82
6.15
Jun
5.09
4.96
Jul
-2.34
2.17
Aug
6.78
1.91
Sep
-0.78
3.53
Oct
-2.74
2.27
Nov
-5.20
0.13
Dec
1.66
-0.05
Total Returns
12.51
15.84
Monthly Returns Comparison Chart
Quarter
Returns %
Compared To SP500 Returns %
Q1 (Jan,Feb,Mar)
-
-4.47
Q2 (Apr,May,Jun)
15.12
10.35
Q3 (Jul,Aug,Sep)
3.66
7.61
Q4 (Oct,Nov,Dec)
-6.27
2.35
Total Returns
12.51
15.84
Month
Returns %
Compared To SP500 Returns %
Jan
19.28
1.37
Feb
1.42
-0.87
Mar
2.46
-5.09
Apr
7.47
10.42
May
4.49
5.15
Jun
0.99
-1.06
Jul
0.23
-0.56
Aug
-
-
Sep
-
-
Oct
-
-
Nov
-
-
Dec
-
-
Total Returns
36.34
9.36
Monthly Returns Comparison Chart
Quarter
Returns %
Compared To SP500 Returns %
Q1 (Jan,Feb,Mar)
23.15
-4.59
Q2 (Apr,May,Jun)
12.96
14.51
Q3 (Jul,Aug,Sep)
0.23
-0.56
Q4 (Oct,Nov,Dec)
-
-
Total Returns
36.34
9.36
*SP500 monthly returns stated above is calculated between end of month closing price to beginning of month closing price.
*The SP 500 is heavily weighted toward the SP 7 — the Magnificent 7 AI and tech giants — while US Bot 60 focuses on the broader SP 493 U.S. stocks plus Mag 7 stocks.