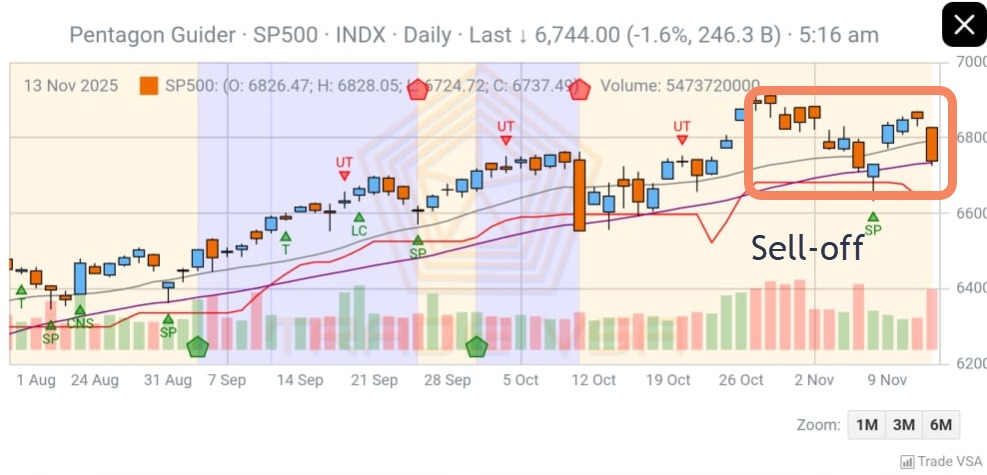
You can copy me!
Learn first before you start trading with real $$$.
| Bot Name | Copy SMARTRobie® MY Bot 37 |
| Fund Size | RM50,000 |
| Average Size Per Trade | RM10,000 |
| Trade Volume | 1 trade per day |
| Market | MY |
| Remark |
• Once account is fully traded (ie 5 stocks @ RM10,000), new trade only be executed when account has balance funding of RM10,000 and above. • This is a simulation account. Trades done are fully automated by our CopySMARTRobie®_37 Bot. |
| Subscription |
• Subscribe CopySMARTRobie® in SMARTRobie® Mobile App's Market Place. • Priced at RM150.00 for 3 months + Bonus 3 months All Exchange Monthly Pass. |
| How Copy SMARTRobie® works ? |
• Ensure you enable in-app notification for SMARTRobie® Mobile Application. • Once you have subscribed to Copy SMARTRobie®, your 3-months All Exchange pass will be activated within 24 hours. • Once All Exchange monthly pass is activated, your Copy SMARTRobie® subscription is activated too. • When SMARTRobie® execute a trade, you will receive the same information via in-app notification. • Check your Copy SMARTRobie® trade idea in your Inbox of your SMARTRobie® app. • Follow Coffee with SMARTRobie® every Monday at 10.15am (FB Live @ FB/SMARTRobie) should you have question on SMARTRobie®. |
| Disclaimer |
• All buy calls are based on ALGO Pentagon Guider® System on SMARTRobie®. See our SMARTRobie® FAQ for all assumptions and limitations. Investing is risky and trading is at your own risk. • Past performance is not an indicator of future performance. There are risks involved in buying and selling shares. Please have proper risk management when trading shares as a loss of money is highly probable. |
| Terms & Conditions |
Read Here: CopySMARTRobie® Terms & Conditions |
View this bot performance as in monthly returns in 2026:
| Month | Returns % | Compared To KLCI Returns % |
|---|---|---|
| Jan | 5.79 | 4.12 |
| Feb | -2.03 | 2.54 |
| Mar | 0.50 | -0.99 |
| Apr | 2.78 | 2.60 |
| May | 12.47 | 1.31 |
| Jun | 5.03 | -0.41 |
| Jul | 3.22 | 2.23 |
| Aug | 2.03 | 3.27 |
| Sep | 2.24 | -1.78 |
| Oct | -0.92 | -2.85 |
| Nov | 1.10 | -0.47 |
| Dec | -3.12 | 3.01 |
| Total Returns | 29.09 | 12.58 |
| Quarter | Returns % | Compared To KLCI Returns % |
|---|---|---|
| Q1 (Jan,Feb,Mar) | 4.26 | 5.67 |
| Q2 (Apr,May,Jun) | 20.28 | 3.50 |
| Q3 (Jul,Aug,Sep) | 7.49 | 3.72 |
| Q4 (Oct,Nov,Dec) | -2.94 | -0.31 |
| Total Returns | 29.09 | 12.58 |
| Month | Returns % | Compared To KLCI Returns % |
|---|---|---|
| Jan | -2.02 | -5.20 |
| Feb | 0.44 | 1.14 |
| Mar | -11.39 | -3.88 |
| Apr | 16.95 | 1.76 |
| May | -2.79 | -2.07 |
| Jun | 3.62 | 1.63 |
| Jul | -1.50 | -1.29 |
| Aug | -2.28 | 4.09 |
| Sep | 5.59 | 2.33 |
| Oct | -3.92 | -0.17 |
| Nov | 6.87 | -0.29 |
| Dec | 11.10 | 4.71 |
| Total Returns | 20.67 | 2.76 |
| Quarter | Returns % | Compared To KLCI Returns % |
|---|---|---|
| Q1 (Jan,Feb,Mar) | -12.96 | -7.94 |
| Q2 (Apr,May,Jun) | 17.78 | 1.32 |
| Q3 (Jul,Aug,Sep) | 1.80 | 5.13 |
| Q4 (Oct,Nov,Dec) | 14.05 | 4.25 |
| Total Returns | 20.67 | 2.76 |
| Month | Returns % | Compared To KLCI Returns % |
|---|---|---|
| Jan | 0.50 | 3.62 |
| Feb | -4.00 | -1.39 |
| Mar | 4.12 | -1.53 |
| Apr | 3.99 | 1.87 |
| May | - | 1.35 |
| Jun | - | - |
| Jul | - | - |
| Aug | - | - |
| Sep | - | - |
| Oct | - | - |
| Nov | - | - |
| Dec | - | - |
| Total Returns | 4.61 | 3.92 |
| Quarter | Returns % | Compared To KLCI Returns % |
|---|---|---|
| Q1 (Jan,Feb,Mar) | 0.62 | 0.70 |
| Q2 (Apr,May,Jun) | 3.99 | 3.22 |
| Q3 (Jul,Aug,Sep) | - | - |
| Q4 (Oct,Nov,Dec) | - | - |
| Total Returns | 4.61 | 3.92 |
*KLCI monthly returns stated above is calculated between end of month closing price to beginning of month closing price.
| Bot Trade Summary | |
|---|---|
| Win Rate % | 50.37% |
| Average Win Per Trade | RM 609.00 |
| Average Loss Per Trade | RM -429.90 |
| Profit Factor | 1.4 |
| Maximum Drawdown % | 14.2% |
| Sharpe Ratio ( > 1.0 is good ) | 4.16 |
| Sortino Ratio ( > 2.0 is good ) | 1.52 |
| All Years Return | Returns % |
|---|---|
| 2024 | 29.09 |
| 2025 | 20.67 |
| 2026 | 4.61 |
| Grand Total Return | 54.38 |
| # | Stock Name | Quantity | Open (RM) | Close (RM) | Trade Result (RM +/-) | Pct % | Date Traded | Closed At | Chart Link | |
|---|---|---|---|---|---|---|---|---|---|---|
| 1 | BNASTRA | 5,100.00 | 1.980 | 1.930 | -255.00 | -2.53 | 2026-04-27 | 2026-05-07 | Chart Link | |
| 2 | PMETAL | 1,200.00 | 8.070 | 8.574 | 604.80 | 6.25 | 2026-04-23 | 2026-04-27 | Chart Link | |
| 3 | CSCSTEL | 6,800.00 | 1.470 | 1.510 | 272.00 | 2.72 | 2026-04-22 | 2026-05-04 | Chart Link | |
| 4 | BAT | 1,700.00 | 5.900 | 6.130 | 391.00 | 3.90 | 2026-04-17 | 2026-04-28 | Chart Link | |
| 5 | DUFU | 7,200.00 | 1.390 | 1.509 | 856.80 | 8.56 | 2026-04-08 | 2026-04-16 | Chart Link | |
| 6 | DELEUM | 8,000.00 | 1.250 | 1.270 | 160.00 | 1.60 | 2026-04-07 | 2026-04-16 | Chart Link | |
| 7 | SWKPLNT | 2,700.00 | 3.700 | 3.490 | -567.00 | -5.68 | 2026-04-06 | 2026-04-15 | Chart Link | |
| 8 | DRBHCOM | 8,900.00 | 1.120 | 1.180 | 534.00 | 5.36 | 2026-04-01 | 2026-04-10 | Chart Link | |
| 9 | SOP | 2,100.00 | 4.700 | 4.620 | -168.00 | -1.70 | 2026-03-31 | 2026-04-09 | Chart Link | |
| 10 | PMETAL | 1,200.00 | 8.090 | 7.950 | -168.00 | -1.73 | 2026-03-30 | 2026-04-08 | Chart Link | |
| 11 | TAKAFUL | 3,000.00 | 3.300 | 3.250 | -150.00 | -1.52 | 2026-03-27 | 2026-04-07 | Chart Link | |
| 12 | WASCO | 10,100.00 | 0.995 | 1.143 | 1,494.80 | 14.87 | 2026-03-25 | 2026-03-27 | Chart Link | |
| 13 | DIALOG | 4,800.00 | 2.080 | 2.253 | 830.40 | 8.32 | 2026-03-24 | 2026-03-26 | Chart Link | |
| 14 | KLK | 500.00 | 19.920 | 21.520 | 800.00 | 8.03 | 2026-03-19 | 2026-04-01 | Chart Link | |
| 15 | RANHILL | 5,600.00 | 1.790 | 1.670 | -672.00 | -6.70 | 2026-03-18 | 2026-03-30 | Chart Link | |
| 16 | JTIASA | 8,500.00 | 1.170 | 1.200 | 255.00 | 2.56 | 2026-03-17 | 2026-03-30 | Chart Link | |
| 17 | THPLANT | 15,700.00 | 0.635 | 0.645 | 157.00 | 1.57 | 2026-03-16 | 2026-03-27 | Chart Link | |
| 18 | SWKPLNT | 2,700.00 | 3.670 | 3.520 | -405.00 | -4.09 | 2026-03-12 | 2026-03-25 | Chart Link | |
| 19 | YINSON | 4,200.00 | 2.400 | 2.310 | -378.00 | -3.75 | 2026-03-11 | 2026-03-24 | Chart Link | |
| 20 | KMLOONG | 4,100.00 | 2.410 | 2.450 | 164.00 | 1.66 | 2026-03-09 | 2026-03-18 | Chart Link | |
| 21 | TAANN | 2,000.00 | 4.980 | 5.180 | 400.00 | 4.02 | 2026-03-06 | 2026-03-17 | Chart Link | |
| 22 | UTDPLT | 300.00 | 30.200 | 32.178 | 593.40 | 6.55 | 2026-03-04 | 2026-03-09 | Chart Link | |
| 23 | DAYANG | 5,200.00 | 1.940 | 1.830 | -572.00 | -5.67 | 2026-03-03 | 2026-03-12 | Chart Link | |
| 24 | LHI | 12,300.00 | 0.810 | 0.800 | -123.00 | -1.23 | 2026-03-02 | 2026-03-11 | Chart Link |